Kubernetes Dashboard
Dashboard is a web-based Kubernetes user interface. You can use Dashboard to deploy containerized applications to a Kubernetes cluster, troubleshoot your containerized application, and manage the cluster resources. You can use Dashboard to get an overview of applications running on your cluster, as well as for creating or modifying individual Kubernetes resources (such as Deployments, Jobs, DaemonSets, etc). For example, you can scale a Deployment, initiate a rolling update, restart a pod or deploy new applications using a deploy wizard.
Dashboard also provides information on the state of Kubernetes resources in your cluster and on any errors that may have occurred.
Configure your local routing
You need to add a route to your local machine to access the internal network of Virtualbox.
sudo ip route add 192.168.4.0/27 via 192.168.4.30 dev vboxnet0
sudo ip route add 192.168.4.32/27 via 192.168.4.62 dev vboxnet0
Access the BusyBox
We need to get the BusyBox IP to access it via ssh:
vboxmanage guestproperty get busybox "/VirtualBox/GuestInfo/Net/0/V4/IP"
Expected output:
Value: 192.168.4.57
Use the returned value to access the BusyBox:
~$ ssh debian@192.168.4.57
Expected output:
Linux busybox 6.1.0-42-amd64 #1 SMP PREEMPT_DYNAMIC Debian 6.1.159-1 (2025-12-30) x86_64

The programs included with the Debian GNU/Linux system are free software;
the exact distribution terms for each program are described in the
individual files in /usr/share/doc/*/copyright.

Debian GNU/Linux comes with ABSOLUTELY NO WARRANTY, to the extent
permitted by applicable law.
Deploy
-
Configure
kubectlin the BusyBox. To do so, copy the configuration from the master node:debian@busybox:~$ mkdir ~/.kube debian@busybox:~$ ssh kube-mast01 'sudo cat /etc/kubernetes/admin.conf' > ~/.kube/config -
Install the Dashboard by applying the
kubernetes-dashboard.yamlfile:debian@busybox:~$ kubectl apply -f https://raw.githubusercontent.com/kubernetes/dashboard/v2.7.0/aio/deploy/recommended.yamlExpected output:
namespace/kubernetes-dashboard created serviceaccount/kubernetes-dashboard created service/kubernetes-dashboard created secret/kubernetes-dashboard-certs created secret/kubernetes-dashboard-csrf created secret/kubernetes-dashboard-key-holder created configmap/kubernetes-dashboard-settings created role.rbac.authorization.k8s.io/kubernetes-dashboard created clusterrole.rbac.authorization.k8s.io/kubernetes-dashboard created rolebinding.rbac.authorization.k8s.io/kubernetes-dashboard created clusterrolebinding.rbac.authorization.k8s.io/kubernetes-dashboard created deployment.apps/kubernetes-dashboard created service/dashboard-metrics-scraper created deployment.apps/dashboard-metrics-scraper created -
Check the state of the pods after the Dashboard deployed:
debian@busybox:~$ kubectl get pods -o wide -n kubernetes-dashboardExpected output:
NAME                                         READY   STATUS    RESTARTS   AGE   IP            NODE          NOMINATED NODE   READINESS GATES
dashboard-metrics-scraper-5657497c4c-68ld8   1/1     Running   0          11s   10.244.8.30   kube-node03   <none>           <none>
kubernetes-dashboard-78f87ddfc-6n2r6         1/1     Running   0          11s   10.244.3.13   kube-node01   <none>           <none>
Notice we now have a pod named
kubernetes-dashboard-78f87ddfc-6n2r6
Configure the Dashboard
serviceaccount
We need a service account to access the K8S Dashboard.
-
Create service account
debian@busybox:~$ kubectl create serviceaccount cluster-admin-dashboard -n kubernetes-dashboard

debian@busybox:~$ kubectl create clusterrolebinding cluster-admin-dashboard \
    --clusterrole=cluster-admin \
    --serviceaccount=kubernetes-dashboard:cluster-admin-dashboard \
    -n kubernetes-dashboard
Expected output:
serviceaccount/cluster-admin-dashboard createdclusterrolebinding.rbac.authorization.k8s.io/cluster-admin-dashboard created
Access the Dashboard
Bearer Token
To access the Dashboard, we need to have a token from the cluster-admin-dashboard service account.
First, try:
debian@busybox:~$ kubectl create token cluster-admin-dashboard -n kubernetes-dashboard
Expected output:
eyJhbGciOiJSUzI1NiIsImtpZCI6IjJDTFJsczdnZndvWFp4Y3NOZ2tyNmU3N3JzaWZxRWFBRER3QUNsN1hIbjAifQ.eyJhdWQiOlsiaHR0cHM6Ly9rdWJlcm5ldGVzLmRlZmF1bHQuc3ZjLmNsdXN0ZXIubG9jYWwiXSwiZXhwIjoxNzY5NTcwNjM5LCJpYXQiOjE3Njk1NjcwMzksImlzcyI6Imh0dHBzOi8va3ViZXJuZXRlcy5kZWZhdWx0LnN2Yy5jbHVzdGVyLmxvY2FsIiwia3ViZXJuZXRlcy5pbyI6eyJuYW1lc3BhY2UiOiJrdWJlcm5ldGVzLWRhc2hib2FyZCIsInNlcnZpY2VhY2NvdW50Ijp7Im5hbWUiOiJjbHVzdGVyLWFkbWluLWRhc2hib2FyZCIsInVpZCI6ImU2NmIzMzVlLTYwN2ItNGFiMy04ODQyLTcxNWM0NmMzYjNlZSJ9fSwibmJmIjoxNzY5NTY3MDM5LCJzdWIiOiJzeXN0ZW06c2VydmljZWFjY291bnQ6a3ViZXJuZXRlcy1kYXNoYm9hcmQ6Y2x1c3Rlci1hZG1pbi1kYXNoYm9hcmQifQ.PlHZvHlT4de7Yely2p_WEU5AcLLuHqO2fzIhhkpJnP_tao-VqnDVbeU7cuainAb8wD1qW9vZaW4eO3Pfiy_zr3_AKxSX59R5dKtZSzkoZBJRSHK07Y2iD9jd3C0Nz2Rg1ACN1t_lNtEoMEZHmr7P18ve7HhUhwrqaOSSTSOTBZpTHzAiSslfwU2q9dE3rph4iSIbRQIPXATgBRydzKByfnud716t-7LWDLgXvwd4MGCH-o95OU9-GxREC02V_41jc-s32cSpJc_BIcK3DyTOyYwN8L0oWJtsv6Rk1yoWpPPJOqCLTYy2RDtLrxy0dzKkIm1wEhz0ToHVdsESl2gP1A
If a token is successfully generated, move on to “View the Dashboard” Section.
We are going to use the
eyJhbGciOiJSUzI1NiIsImtpZCI6IjJDTFJsczdnZ...Yy2RDtLrxy0dzKkIm1wEhz0ToHVdsESl2gP1Atoken. For shortness, we show only the first and last blocks here, but we must use the full printed value to access the Dashboard.
View the Dashboard
-
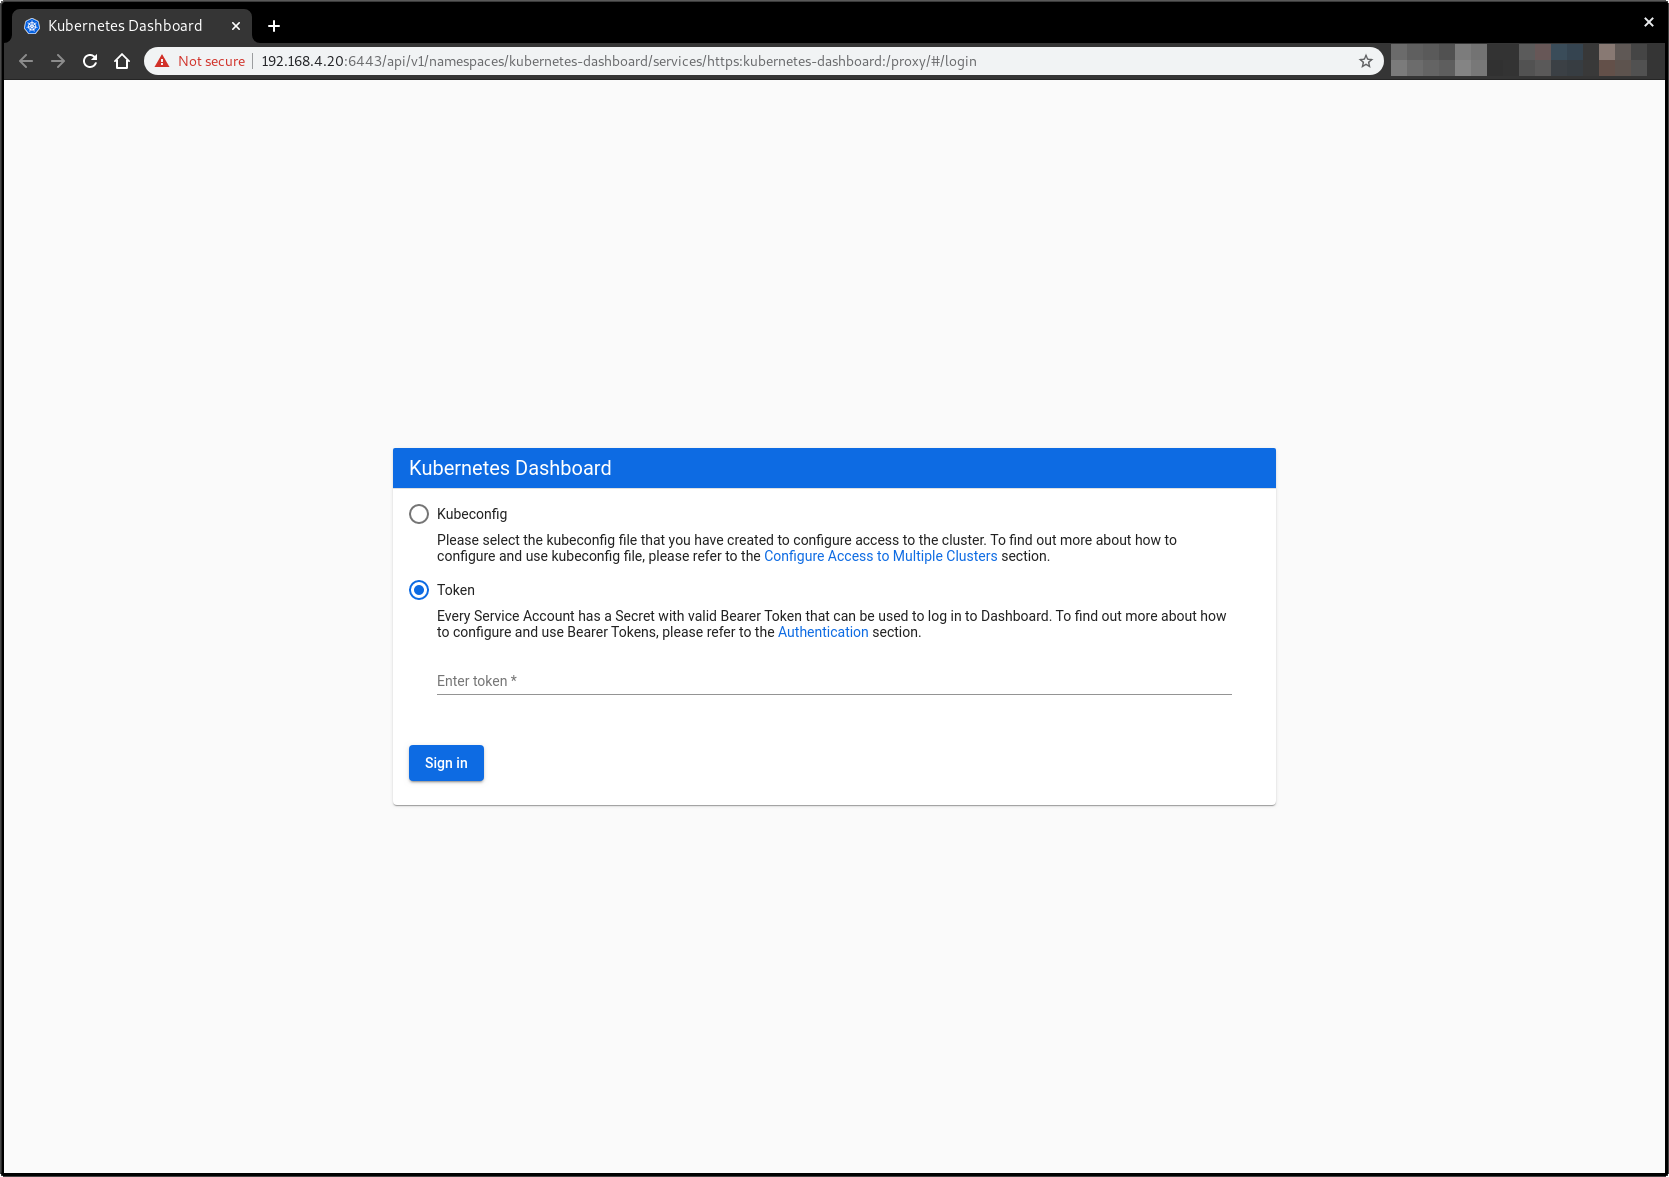
To view the Dashboard, open your browser at https://192.168.4.20:6443/api/v1/namespaces/kubernetes-dashboard/services/https:kubernetes-dashboard:/proxy/
By now, you should get an
Access Deniederror similar to the following:{ "kind": "Status", "apiVersion": "v1", "metadata": {}, "status": "Failure", "message": "services \"https:kubernetes-dashboard:\" is forbidden: User \"system:anonymous\" cannot get resource \"services/proxy\" in API group \"\" in the namespace \"kubernetes-dashboard\"", "reason": "Forbidden", "details": { "name": "https:kubernetes-dashboard:", "kind": "services" }, "code": 403 } -
To solve this issue, create a role to access
kubernetes-dashboardresources. The yaml block below is just for clarity. The important part is the console command right after that:kind: ClusterRole apiVersion: rbac.authorization.k8s.io/v1 metadata: name: kubernetes-dashboard-anonymous rules: - apiGroups: [""] resources: ["services/proxy"] resourceNames: ["https:kubernetes-dashboard:"] verbs: ["get", "list", "watch", "create", "update", "patch", "delete"] - nonResourceURLs: [ "/ui", "/ui/*", "/api/v1/namespaces/kube-system/services/https:kubernetes-dashboard:/proxy/*", ] verbs: ["get", "list", "watch", "create", "update", "patch", "delete"]debian@busybox:~$ cat <<EOF | kubectl apply -f - kind: ClusterRole apiVersion: rbac.authorization.k8s.io/v1 metadata: name: kubernetes-dashboard-anonymous rules: - apiGroups: [""] resources: ["services/proxy"] resourceNames: ["https:kubernetes-dashboard:"] verbs: ["get", "list", "watch", "create", "update", "patch", "delete"] - nonResourceURLs: ["/ui", "/ui/*", "/api/v1/namespaces/kube-system/services/https:kubernetes-dashboard:/proxy/*"] verbs: ["get", "list", "watch", "create", "update", "patch", "delete"] EOFExpected output:
clusterrole.rbac.authorization.k8s.io/kubernetes-dashboard-anonymous created -
Create the role binding for anonymous access (
system:anonymous) - again, the yaml block below is just for clarity:apiVersion: rbac.authorization.k8s.io/v1 kind: ClusterRoleBinding metadata: name: kubernetes-dashboard-anonymous roleRef: apiGroup: rbac.authorization.k8s.io kind: ClusterRole name: kubernetes-dashboard-anonymous subjects: - kind: User name: system:anonymousdebian@busybox:~$ cat <<EOF | kubectl apply -f - apiVersion: rbac.authorization.k8s.io/v1 kind: ClusterRoleBinding metadata: name: kubernetes-dashboard-anonymous roleRef: apiGroup: rbac.authorization.k8s.io kind: ClusterRole name: kubernetes-dashboard-anonymous subjects: - kind: User name: system:anonymous EOFExpected output:
clusterrolebinding.rbac.authorization.k8s.io/kubernetes-dashboard-anonymous created -
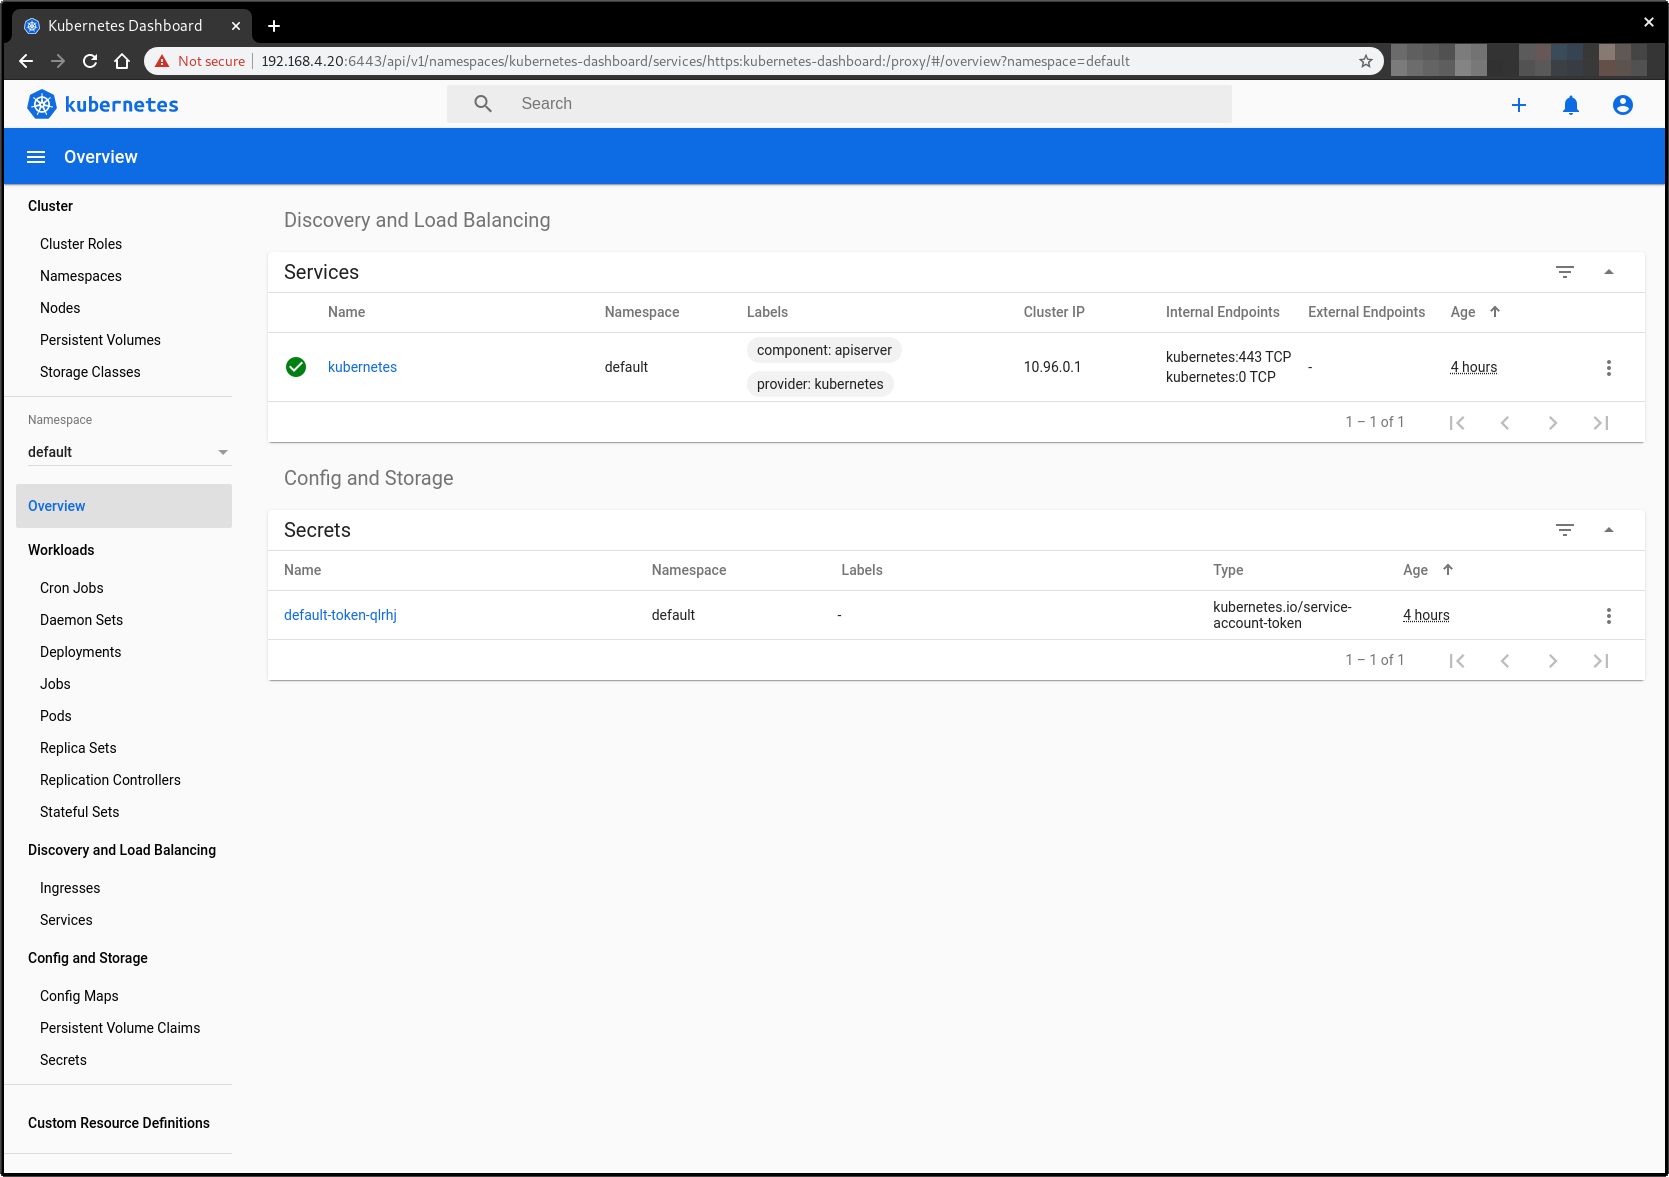
Now, copy and paste the token when prompted for it in the log in screen:
-
Click the Sign In button and that’s it. You are now logged in as an admin: